Help & Guide

How-to guides and real screenshots for every feature in OwnBI.

Getting started with OwnBI

OwnBI is your AI-native business intelligence workspace: connect any data source, ask questions in plain language with Aria, build dashboards with AI or drag-and-drop, write SQL, define governed metrics, run no-code forecasts, generate data stories, collaborate on decisions, automate report delivery, enforce security, and embed analytics in your own product. This guide walks through every screen with real steps and screenshots — no onboarding session required.

Orientation — the things to know first

  1. 1Sign in at the login screen with your work email and password. The demo workspace uses anshul@techvista.com. On success you land on the Home dashboard.
  2. 2The dark left sidebar is your primary navigation. It lists every workspace area — Ask Aria, Dashboards, Data Sources, SQL Editor, Metrics, Predict, Stories, Collaborate, Insights, Schedules, Governance, Embed, and Settings. Each item shows its product name and a short descriptor (e.g. "DataBridge", "Canvas Studio").
  3. 3Collapse or expand the sidebar with the menu (hamburger) button in the top-left of the header to reclaim screen space.
  4. 4The top header has a global "Ask Aria anything…" search box — type a question and press Enter to jump straight into a conversational answer. On the right are the notifications bell and your account avatar (which opens Settings).
  5. 5Your active workspace name appears at the top of the sidebar (e.g. "TechVista Analytics"). All data, dashboards, and members are scoped to this workspace.
  6. 6Open this Help guide anytime from the "Help & Guide" link pinned at the bottom of the sidebar.

Getting in & Home

Signing in and reading your daily intelligence brief.

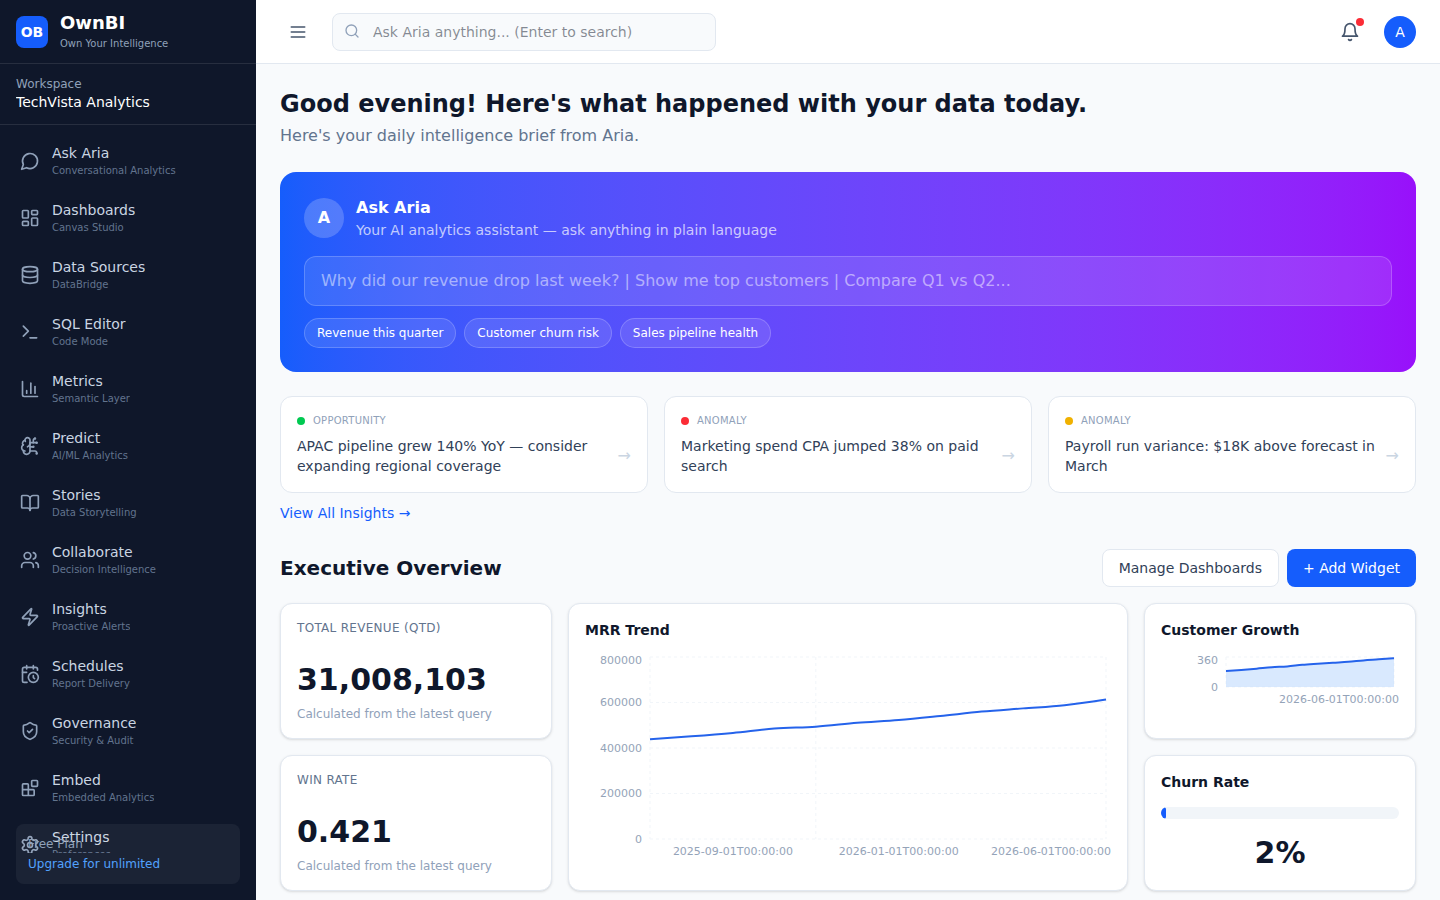
Signing in & creating an account

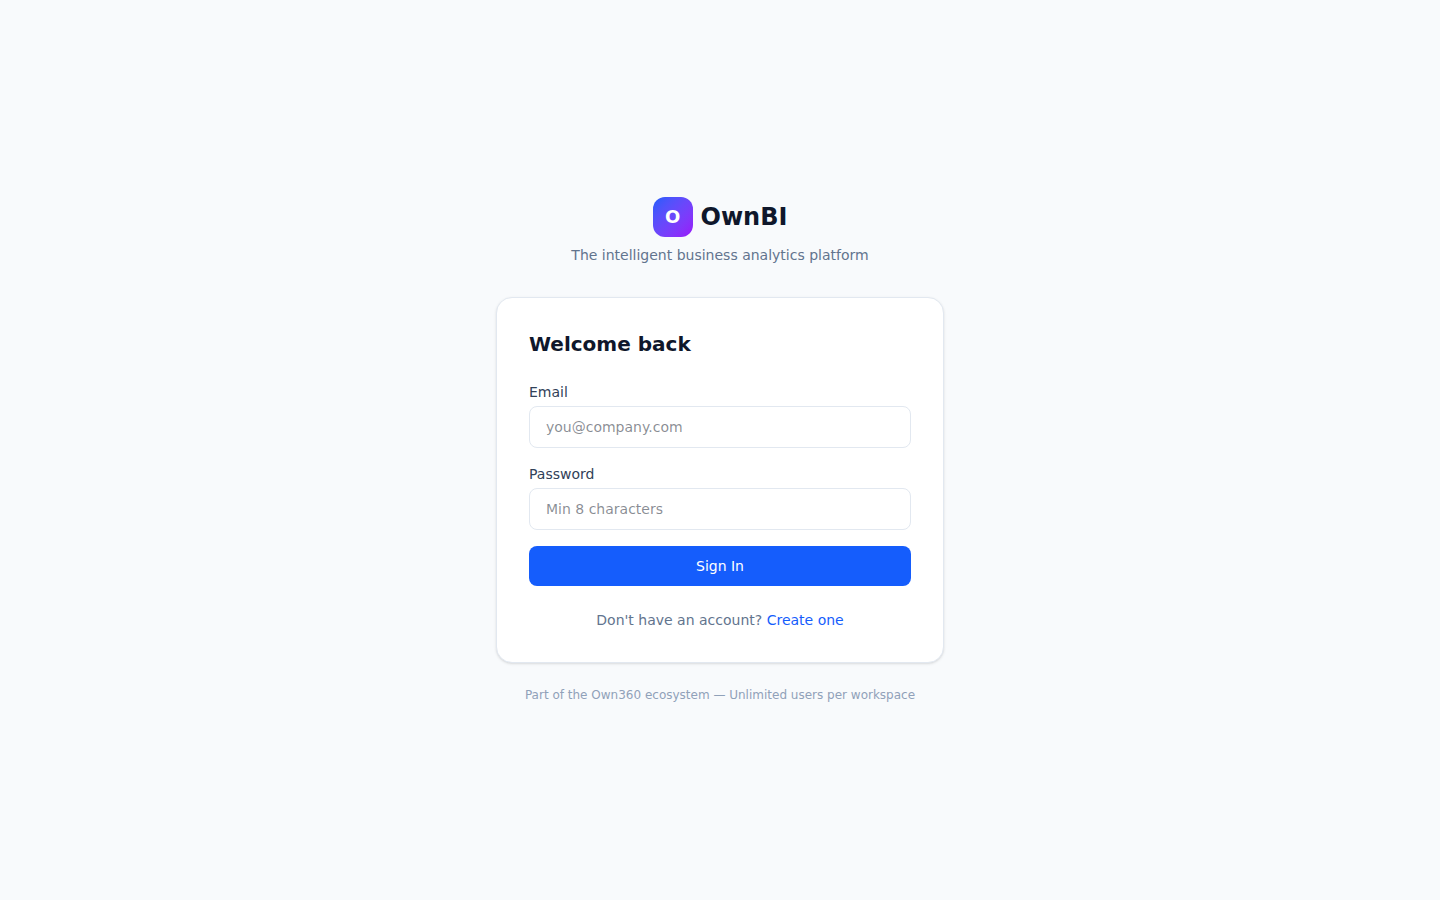
OwnBI uses email/password authentication. On a successful sign-in the app stores a bearer token, auto-loads your first workspace, and routes you to the Home dashboard. New users can self-register from the same screen.

Where to find it: The login screen (/login)
The OwnBI sign-in screen.

Step-by-step

  1. 1Go to /login. You'll see the OwnBI logo and a "Welcome back" card.
  2. 2Enter your work email and password.
  3. 3Click "Sign In". On success you are taken to the Home dashboard and your workspace loads automatically.
  4. 4To create a new account, click the sign-up toggle, fill in Full Name, Email, and Password (minimum 8 characters), then click "Create Account".

Tips & pitfalls

  • If sign-in fails, an inline red banner appears above the form — re-check your email and password.
  • Passwords must be at least 8 characters when registering.

Home — your daily intelligence brief

The Home page is your landing dashboard. It opens with a personalized greeting and an AI "daily brief" summarizing what changed in your data, a quick Ask Aria prompt, and an Executive Overview with key KPIs and trend charts. It's the fastest way to get oriented each morning.

Where to find it: Home (the OwnBI logo or / route)
Home: greeting, daily brief, Ask Aria prompt, and Executive Overview KPIs.

Step-by-step

  1. 1Click the OwnBI logo at the top of the sidebar (or open /) to return Home at any time.
  2. 2Read the daily brief banner at the top for an AI summary of notable changes in your data.
  3. 3Use the inline "Ask Aria" prompt to ask a quick question without leaving Home.
  4. 4Scroll to the Executive Overview to see KPI tiles (e.g. Total Revenue, MRR Trend, Customer Growth, Churn Rate) and click "+ Add Widget" to extend it.

Tips & pitfalls

  • The greeting changes by time of day; the brief is regenerated from your latest workspace data.

Ask Aria — Conversational Analytics

Get trustworthy visual answers by asking questions in plain language.

Asking Aria a question

Ask Aria is OwnBI's conversational analytics assistant. You ask a business question in natural language and Aria translates it to a query, runs it against your data, and returns a written answer plus a chart, a confidence score, the generated SQL ("View SQL"), and suggested follow-up questions. It supports English and Hindi.

Where to find it: Sidebar → Ask Aria (/aria), or the global search box in the header
The Ask Aria chat with starter prompt suggestions.
An Aria answer: written summary, chart, confidence score, View SQL, and follow-up chips.

Step-by-step

  1. 1Open Ask Aria from the sidebar (or type in the header's "Ask Aria anything…" box and press Enter).
  2. 2Click one of the suggested starter prompts (e.g. "What are our top performing products?") or type your own question in the "Ask Aria anything about your data…" box.
  3. 3Press Enter or click the send button. Aria responds with a written answer, a chart, and a confidence indicator.
  4. 4Click "View SQL" under any answer to inspect the exact query Aria generated.
  5. 5Click a follow-up suggestion chip (e.g. "What are the key trends?") to drill deeper in the same conversation.

Tips & pitfalls

  • Aria supports Hindi — try "kitna bikri hua is mahine?" (How much sales this month?).
  • Each answer shows a confidence score; lower confidence is a cue to verify with the SQL Editor or a metric.
  • The header search box routes to Aria with your question pre-filled.

AI Agents — OwnAgents & OwnIQ

Turn plain-language tasks into real BI actions — in-perimeter, permission-bound, and audit-logged.

Overview — what the AI Agents do

OwnBI is part of Own360's System of Action. Beyond Ask Aria's conversational answers, OwnBI can be driven by AI agents — OwnAgents — that take a plain-English task and carry it out as real actions inside the app (creating dashboards, running queries, building metrics, and more). A central runtime dispatches a task with the target app pinned, and a supervisor routes it to OwnBI's agent-callable surface. The agents reason through OwnIQ, Own360's sovereign AI gateway, which keeps every model call in-perimeter (your data never leaves the boundary), permission-bound (the agent can only do what your role allows), and audit-logged (every action is recorded in the Governance audit log). In short: you describe the outcome in words, and the agent produces a real, verifiable result you can open and inspect — it does not just chat about it.

Where to find it: Available throughout OwnBI; the primary in-app entry point is Ask Aria (sidebar → Ask Aria), with results landing in Dashboards, Metrics, and other workspace areas.
Aria turns a natural-language question into a real query, chart, confidence score, and inspectable SQL — the same agentic flow that powers actions.

Step-by-step

  1. 1Understand the model: you state an outcome in natural language; the agent plans and executes real actions in OwnBI rather than returning prose only.
  2. 2Know the guardrails: requests run through OwnIQ in-perimeter, are bound to your permissions, and are written to the audit log — so agent actions are as governed as anything you do by hand.
  3. 3Pick your entry point: use Ask Aria for conversational questions and the AI Dashboard Builder for build tasks (both are the user-facing front-ends to the agent capabilities).
  4. 4Always verify: open the created resource, expand "View SQL", check the confidence score, and review the Governance audit log before you trust or share a result.

Tips & pitfalls

  • "In-perimeter" means your data and the model calls stay inside your Own360 boundary — nothing is sent to an external service.
  • Agents are permission-bound: if your role can't create a dashboard manually, the agent can't either.
  • Every agent action is recorded in Governance → Audit Log, giving you a full trail of who/what/when.

Tasks the agents can perform

The agents operate over OwnBI's real entities — datasets, dashboards, queries, metrics, reports, charts, and alerts — and the app's domain operations (run a query, refresh a dashboard). In practice that maps to the same capabilities you have in the UI, now driven by natural language. The representative cohort task for OwnBI is: "Create a dashboard 'Sales Pipeline Health' with three widgets: pipeline coverage, deals at risk, win rate by stage." Only the capabilities listed below are real today — agents do not perform actions OwnBI itself doesn't support.

Where to find it: Capabilities surface across Ask Aria (/aria), Dashboards (/dashboards), Metrics (/metrics), Predict (/predict), and Insights (/insights).
The AI Dashboard Builder: describe a dashboard in plain English and the agent builds it — the create-dashboard task in action.
Predict exposes no-code forecasting and analysis that agents can drive (forecasts, cohorts, funnels, scenarios).

Step-by-step

  1. 1Ask conversational questions (Ask Aria): translate a business question into a query and get a chart, written answer, confidence score, and the generated SQL.
  2. 2Create dashboards and widgets (Canvas): build a dashboard from a description — e.g. "Sales Pipeline Health" with pipeline coverage, deals at risk, and win rate by stage widgets.
  3. 3Run and refresh queries: execute a query and refresh a dashboard to pull the latest data (the app's run_query and refresh_dashboard operations).
  4. 4Build governed metrics (Metric Store): define a metric in the semantic layer so terms like "revenue" mean the same thing everywhere.
  5. 5Produce forecasts and predictive analyses (Predict): no-code time-series forecasts, cohort/funnel analysis, what-if scenarios, and goal-seek — with confidence intervals.
  6. 6Surface insights and alerts (Insights): detect anomalies, trends, and opportunities, and turn a finding into a tracked action item.

Tips & pitfalls

  • Be specific: name the resource and the exact widgets/metrics you want ("three widgets: pipeline coverage, deals at risk, win rate by stage") so the agent's plan matches your intent.
  • If a request isn't one of these real capabilities, the agent won't invent it — break the goal into supported steps instead.
  • Build tasks land as real resources (a new dashboard, metric, etc.) that you can open, edit, and govern like anything else.

How to use the agents — step by step

The simplest way to use the agent capabilities is through Ask Aria (for questions) and the AI Dashboard Builder (for build tasks) — both take plain language. This walkthrough does one of each: an Aria query you can verify with View SQL, and the representative build task that creates the "Sales Pipeline Health" dashboard. At each step you review and confirm what the agent produced before trusting it.

Where to find it: Ask Aria (sidebar → Ask Aria) for the query; Dashboards → AI Dashboard Builder (sidebar → Dashboards) for the build task.
Step 1–4: an Aria answer with a written summary, chart, 75% confidence, and an expandable "View SQL" to inspect the exact query.
Step 5–8: the AI Dashboard Builder — type the dashboard description and click "Build with AI".

Step-by-step

  1. 1Open Ask Aria from the sidebar (or type in the header's "Ask Aria anything…" box and press Enter).
  2. 2Type a business question — e.g. "What are our top performing products?" — and press Enter or click the send button.
  3. 3Read the agent's answer: a written summary, a chart, and a confidence score (e.g. 75% confidence).
  4. 4Click "View SQL" beneath the answer to expand and confirm the exact query the agent generated before you act on it.
  5. 5Now do a build task: open Dashboards from the sidebar and find the "AI Dashboard Builder" panel.
  6. 6Choose the data source, then type the task in plain English: "Create a dashboard 'Sales Pipeline Health' with three widgets: pipeline coverage, deals at risk, win rate by stage."
  7. 7Click "Build with AI" and wait while the agent plans and builds the dashboard.
  8. 8Review the generated dashboard — confirm the title is "Sales Pipeline Health" and that the three requested widgets are present before sharing it.

Tips & pitfalls

  • The header's global "Ask Aria anything…" box routes straight into Aria with your question pre-filled.
  • Use the example prompt chips in the AI Dashboard Builder to see well-formed task phrasing.
  • Confirm before you trust: "View SQL" and the confidence score let you sanity-check an answer; opening the new dashboard verifies a build task.

Verifying agent results

Because agents take real actions, you should always verify the output the way you'd verify your own work. There are three checks: (1) open the created resource and confirm it matches the request; (2) for an Aria answer, expand "View SQL" and read the confidence score to validate the logic; and (3) review the Governance audit log to confirm the action ran and see exactly what it did. If something is wrong, you correct it the same way you correct any OwnBI resource — re-ask with a clearer prompt, edit the dashboard/metric directly, or cross-check the numbers in the SQL Editor.

Where to find it: The created resource (e.g. /dashboards), the "View SQL"/confidence panel under an Aria answer (/aria), and Governance → Audit Log (/governance).
Governance → Audit Log: every agent action is recorded (action, resource, details, time) so you can confirm what ran.
Validate an Aria answer with the confidence score and by expanding "View SQL" to read the exact query.

Step-by-step

  1. 1Open the created resource: for a build task, go to Dashboards and open the new dashboard (e.g. "Sales Pipeline Health") and confirm the requested widgets are present.
  2. 2Validate an Aria answer: under the answer, read the confidence score and click "View SQL" to inspect the generated query — low confidence is a cue to dig deeper.
  3. 3Cross-check the numbers: paste or rewrite the generated SQL in the SQL Editor (sidebar → SQL Editor), run it against the same source, and compare results.
  4. 4Check the audit trail: open Governance from the sidebar and review the Audit Log — confirm the action, resource, details, and time match what you expected.
  5. 5Correct a wrong result: re-ask Aria with a more specific prompt, edit the dashboard/metric directly in the UI, or fix the underlying data source — then re-verify.

Tips & pitfalls

  • Confidence is a signal, not a guarantee — always pair a low score with a "View SQL" read or an SQL Editor cross-check.
  • The audit log gives you who/what/when for every agent action, which is essential for trust and compliance reviews.
  • If an answer relies on an ambiguous term, define it in the Metric Store so future agent runs use the governed definition.

Data Sources — DataBridge

Connect databases, warehouses, files, APIs, and Own360 apps.

Connecting a data source

DataBridge is where you connect everything OwnBI analyzes. It supports databases (PostgreSQL, MySQL), warehouses (Snowflake, BigQuery, Redshift), files (CSV/Excel, Google Sheets), REST APIs, SaaS apps (Salesforce, Stripe, HubSpot, Shopify), and native Own360 apps (OwnCRM, OwnHR, OwnERP, OwnMAP). Connected sources show status, preview row count, and a data-quality score.

Where to find it: Sidebar → Data Sources (/datasources)
DataBridge: connected sources with status and quality, plus available connectors.

Step-by-step

  1. 1Open Data Sources from the sidebar.
  2. 2Review existing connections under "Connected Sources" — each shows its type, preview rows, quality score, and a connected/error status badge.
  3. 3Scroll to "Available Connectors" and pick the connector you want (e.g. PostgreSQL, CSV / Excel, Snowflake, OwnCRM).
  4. 4Fill in the connection form. The form pre-populates a sensible default config (host, port, username, etc.); for files you can paste content or a local path.
  5. 5Save the connection. Once connected, the source appears in the Connected Sources list.
  6. 6Expand a connected source to introspect its schema (tables/columns), which makes it available to SQL Editor, Dashboards, and Aria.

Tips & pitfalls

  • Connectors are grouped by category (Database, Data Warehouse, Files, API, SaaS, Own360) so you can scan quickly.
  • The data-quality score helps you spot sources that need attention before you build on them.
  • From a connected source you can also click "Create Starter Dashboard" to auto-build a first dashboard.

Dashboards — Canvas Studio

Build visual dashboards with AI or drag-and-drop.

Creating a dashboard

Canvas is OwnBI's dashboard builder. You can create a blank dashboard and add widgets, let the AI Dashboard Builder generate one from a plain-English description, start from a starter/template dashboard tied to a connected source, or use one-click quickstart cards.

Where to find it: Sidebar → Dashboards (/dashboards)
Canvas dashboard list with the AI Dashboard Builder and starter templates.
The Create Dashboard form alongside the AI builder and starter dashboards.

Step-by-step

  1. 1Open Dashboards from the sidebar.
  2. 2Click "+ New Dashboard" (top-right) to open the Create Dashboard form.
  3. 3Enter a Dashboard title, an optional description, and select the data source from the dropdown.
  4. 4Click "Create" to make a blank dashboard, or "Cancel" to dismiss the form.
  5. 5To build with AI instead, use the "AI Dashboard Builder": pick a data source, type a description (e.g. "Build me a sales dashboard with revenue trend, pipeline funnel, and rep leaderboard"), and click "Build with AI".
  6. 6To start fast, click one of the "Starter Dashboards" cards (one per connected source) to generate a ready-made dashboard.

Tips & pitfalls

  • The AI builder shows example prompt chips (e.g. "Sales overview with KPIs and pipeline") — click one to prefill.
  • Open an existing dashboard to view its widgets; use a date-range filter (Today, Last 7 days, This quarter, etc.) to scope the data.

SQL Editor — Code Mode

Write, run, and save SQL against any connected source.

Running and saving SQL queries

The SQL Editor (Code Mode) is for analysts who want full control. Select a connected datasource, write SQL in the editor, run it to see tabular results, review your query history, and save frequently used queries to a library.

Where to find it: Sidebar → SQL Editor (/sql-editor)
The SQL Editor with a datasource selector, editor pane, and run controls.
Query results rendered in a table after clicking Run Query.

Step-by-step

  1. 1Open SQL Editor from the sidebar.
  2. 2Select a connected datasource from the dropdown at the top — you must pick one before running SQL.
  3. 3Type your SQL in the editor (e.g. SELECT * FROM customers LIMIT 10).
  4. 4Click "Run Query" to execute. Results appear in a table below the editor.
  5. 5Click "Save Query" to store it: give it a name and optional description, then confirm. Saved queries appear in your saved-queries list for reuse.
  6. 6Use the query history to re-open and re-run earlier queries.

Tips & pitfalls

  • If you see "Connect a datasource and select it before running SQL", choose a source in the dropdown first.
  • Saving a query keeps its datasource association so it runs against the right source next time.

Metrics — Semantic Layer

Define governed metrics and a shared business glossary.

Defining metrics & glossary terms

The Metric Store is OwnBI's semantic layer — a single source of truth so "revenue" or "active user" means the same thing everywhere (Aria, dashboards, reports). You define metrics with their calculation and add business glossary terms so everyone shares the same definitions.

Where to find it: Sidebar → Metrics (/metrics)
The Metric Store: governed metrics and the business glossary.

Step-by-step

  1. 1Open Metrics from the sidebar.
  2. 2Click to open the "Define New Metric" form.
  3. 3Fill in the metric's name, definition/calculation, and any associated model or source fields.
  4. 4Click "Create Metric" to publish it to the semantic layer.
  5. 5To add terminology, use "+ Add Term" in the glossary section and define the business term, then save.

Tips & pitfalls

  • Metrics defined here are reused by Aria and dashboards, so define once and reuse everywhere.
  • Use the glossary to align teams on ambiguous terms before they cause reporting disputes.

Predict — AI/ML Analytics

No-code forecasting, cohorts, funnels, scenarios, and goal-seek.

Running a predictive analysis

Predict brings no-code predictive modeling to every business question: time-series forecasting, cohort analysis, funnel analysis, what-if scenarios, and goal-seek. You pick a capability, fill in a few field names from your data, and Predict runs the model and visualizes the result.

Where to find it: Sidebar → Predict (/predict)
Predict: no-code predictive capabilities with simple input fields.

Step-by-step

  1. 1Open Predict from the sidebar.
  2. 2Choose a capability (e.g. Forecast, Cohort, Funnel, Scenario, Goal-seek).
  3. 3Fill in the requested fields — for a forecast that's Table Name, Date Column, Value Column, and Forecast Periods (horizon).
  4. 4Click "Run Analysis" (the button shows "Running…" while it computes).
  5. 5Review the chart and outputs, including confidence intervals for forecasts.

Tips & pitfalls

  • Each capability lists the exact fields it needs with example placeholders (e.g. table_name → "monthly_revenue").
  • Forecasts return confidence intervals so you can communicate uncertainty, not just a single line.

Stories — Data Storytelling

Turn dashboards into narratives, reports, and presentation decks.

Generating a report or presentation

Story turns data into compelling narratives. Pick a dashboard and OwnBI generates an AI-written narrative report explaining the trends, or builds a presentation deck you can share with stakeholders — no manual slide-making required.

Where to find it: Sidebar → Stories (/stories)
Story: generate narrative reports or presentation decks from a dashboard.

Step-by-step

  1. 1Open Stories from the sidebar.
  2. 2Select a dashboard from the dropdown to use as the source.
  3. 3Click "Generate Report" to produce an AI-written narrative explaining the data (the button shows "Generating…" while it works).
  4. 4Click "Build Deck" to assemble a presentation deck of slides instead.
  5. 5Review the output and share it with stakeholders.

Tips & pitfalls

  • Reports are great for written context; decks are better for live stakeholder reviews.
  • Build the underlying dashboard first — Story narrates whatever the dashboard shows.

Collaborate — Decision Intelligence

Comment, assign action items, and log decisions in one place.

Comments, action items & decisions

Collaborate is OwnBI's decision-intelligence layer: discuss findings with comments, turn insights into tracked action items with owners and statuses, and log the decisions you make so there's a durable record of why. Stat tiles at the top summarize collaboration activity.

Where to find it: Sidebar → Collaborate (/collaborate)
Collaborate: comments, action items, and decision log with activity stats.

Step-by-step

  1. 1Open Collaborate from the sidebar.
  2. 2Click "+ Add Comment" to start a discussion (optionally tied to a dashboard).
  3. 3Click "+ Create Action" to create a tracked action item with a title and details.
  4. 4Update an action item's status as work progresses (the status updates in place).
  5. 5Log a decision so the rationale is recorded alongside the data that informed it.

Tips & pitfalls

  • Action items created from an Insight carry the originating context, keeping the trail from signal to action.
  • The top stat tiles give a quick read on open actions and recent activity.

Insights — Proactive Alerts

AI-detected anomalies, trends, and opportunities — pushed to you.

Detecting anomalies & trends

Insights is proactive intelligence: OwnBI scans your data for anomalies, trends, and opportunities and surfaces them so you don't have to monitor dashboards manually. You can run detection on demand and turn any finding into an action item.

Where to find it: Sidebar → Insights (/insights)
Insights: AI-detected anomalies, trends, and opportunities.

Step-by-step

  1. 1Open Insights from the sidebar.
  2. 2Click "Run Detection" to open the "Run Anomaly / Trend Detection" form.
  3. 3Configure the detection inputs and run it.
  4. 4Review surfaced anomalies, trends, and opportunities in the list.
  5. 5For any finding, click "+ Create Action Item" to route it into Collaborate for follow-up.

Tips & pitfalls

  • Insights complements Schedules: use Insights for ad-hoc discovery and Schedules for recurring delivery.
  • The "Run Detection" button toggles to "Close" while the form is open.

Schedules — Report Delivery

Automate recurring dashboards, reports, and alerts.

Scheduling automated delivery

Schedules automates recurring report delivery so stakeholders get the numbers on time without logging in. You create a schedule against a dashboard or report, set a frequency and recipients, and OwnBI delivers it. You can toggle schedules on/off, run them on demand, and review a delivery log.

Where to find it: Sidebar → Schedules (/schedules)
Schedules: recurring delivery of dashboards and reports with a delivery log.

Step-by-step

  1. 1Open Schedules from the sidebar.
  2. 2Click "+ New Schedule" to open the Create Schedule form.
  3. 3Give the schedule a name, pick the resource (dashboard/report), set the frequency, channels, and recipients.
  4. 4Click "Create Schedule" to save it.
  5. 5Use "Run Now" on a schedule card to send it immediately, or toggle it active/inactive.
  6. 6Check the delivery log to confirm past deliveries and recipients.

Tips & pitfalls

  • You need at least one dashboard before you can create a schedule (the Create button stays disabled otherwise).
  • Channels can include email and Slack; recipients can be addresses or channels (e.g. "#leadership-channel").

Governance — Trust & Security

Row-level security, column masking, audit log, and certification.

Securing & certifying data

Govern is OwnBI's trust and security center. Define row-level security (RLS) policies so users only see rows they're allowed to, mask sensitive columns, review an audit log of access and changes, and certify trusted datasets/dashboards so consumers know what's vetted.

Where to find it: Sidebar → Governance (/governance)
Govern: RLS policies, column masking, audit log, and certification.

Step-by-step

  1. 1Open Governance from the sidebar.
  2. 2Under row-level security, click "+ Add Policy" to open the policy form.
  3. 3Define the policy (data source, table, filter column, user attribute, and filter expression) and click "Create Policy".
  4. 4Add column-masking policies to hide sensitive fields from unauthorized roles.
  5. 5Review the audit log to see who accessed or changed what, and when.
  6. 6Certify a trusted resource so consumers can rely on it.

Tips & pitfalls

  • RLS expressions can reference the current user (e.g. {{user.email}}, {{user.role}}) to scope rows per person.
  • Certification signals trust — certify only after a dataset has been validated.

Embed — Embedded Analytics

White-label OwnBI dashboards inside your own product.

Embedding dashboards & managing tenants

Embed lets you put OwnBI dashboards inside your own application with minimal code. You create an embed configuration for a dashboard, get an iframe snippet, and manage per-customer tenants for multi-tenant, white-label embedded analytics.

Where to find it: Sidebar → Embed (/embed)
Embed: create embed configs and manage tenants for white-label analytics.

Step-by-step

  1. 1Open Embed from the sidebar.
  2. 2Click "+ New Embed Config" to open the Create Embed Configuration form.
  3. 3Select the dashboard to embed and configure the options.
  4. 4Copy the generated iframe snippet into your product to render the dashboard.
  5. 5To serve multiple customers, click "+ Add Tenant", fill in the tenant details, and click "Create Tenant".

Tips & pitfalls

  • Tenants enable per-customer isolation for multi-tenant SaaS embedding.
  • The embed snippet is just a few lines — paste it where you want the dashboard to appear.

Settings, Members & Notifications

Profile, workspace, team, billing, API keys, and your notifications.

Managing settings, team & API keys

Settings is where you manage your account and workspace. It's organized into tabs: Profile, Workspace, Members (invite teammates and set roles), Billing (plan and usage), and API Keys (programmatic access). Your avatar in the header opens Settings.

Where to find it: Sidebar → Settings (/settings), or the avatar in the header
Settings with Profile, Workspace, Members, Billing, and API Keys tabs.

Step-by-step

  1. 1Open Settings from the sidebar or click your avatar in the top-right.
  2. 2Use the tabs (Profile, Workspace, Members, Billing, API Keys) to navigate.
  3. 3On Profile/Workspace, edit fields and click "Save Changes".
  4. 4On Members, click "Invite Member", enter an email and role, and send the invite; change a member's role or remove them as needed.
  5. 5On API Keys, click "Create API Key", name it, and copy the key for programmatic access.
  6. 6On Billing, review your current plan and usage against limits.

Tips & pitfalls

  • Member roles (e.g. admin, manager) control who can edit sensitive settings.
  • Treat API keys like passwords — copy them once and store them securely.

Notifications

The Notifications center collects in-app alerts — report deliveries, scheduled-run results, and other workspace activity. The bell icon in the header opens it, with a red dot indicating unread items.

Where to find it: Header bell icon → Notifications (/notifications)
The Notifications center listing workspace alerts.

Step-by-step

  1. 1Click the bell icon in the top-right of the header (a red dot means you have unread items).
  2. 2Review the list of notifications, newest first.
  3. 3Mark an individual notification as read, or mark all as read to clear the count.

Tips & pitfalls

  • Notifications are workspace-scoped; switching workspaces shows that workspace's alerts.
  • Scheduled report deliveries post success notifications here so you can confirm they went out.